The new version of Insights gives you even greater visibility into your project’s performance. This new version provides support for Git, and GitHub.
As a project leader, maintainer, administrator, or anyone wanting to understand the overall health of a project, these metrics are important:
- The number of active contributors
- The increase in contributor growth
- Contributor drift
- Pull request cycle time
- Lines of code added and removed
It helps us to recognize and understand:
- The leading indicators to track project health
- Identify which metrics are most important for your success
- How to optimize CI processes
- How to assess maintainer workloads
Step 1: Access the new version of Insights
Head over to Insights and type the name of your project. For this post, we will use Academy Software Foundation (ASWF).

You now have full access to ASWF and its sub-project metrics. Note that each metric graph is downloadable.
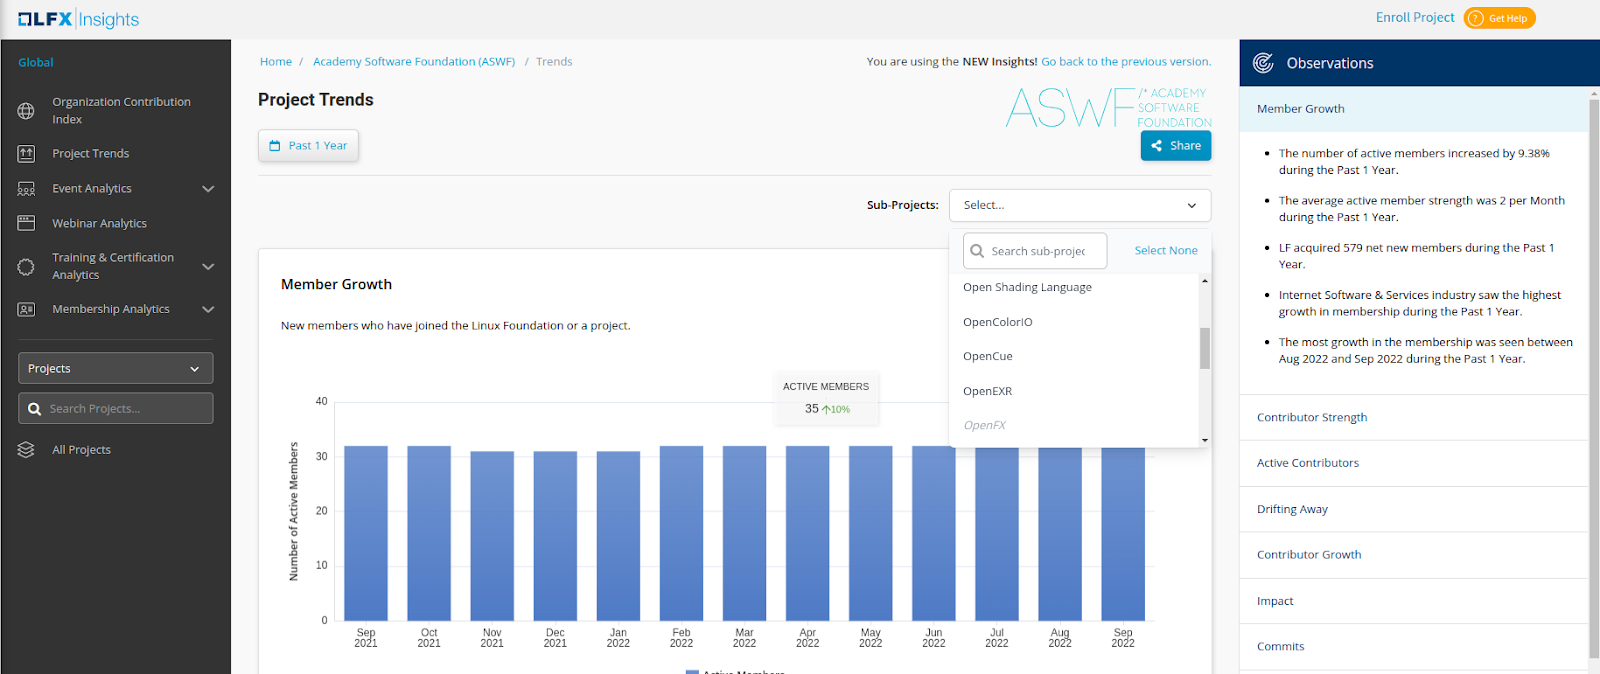
One of our new features is the Observations panel on the right side.

Simply click on each category to reveal the key observations for each trend. In this example we are able to see the top 5 metrics for Member Growth.
Step 2: Access your project’s metrics
In the left-hand navigation type in your project. (For this example we are referencing ASWF). There are four categories: Trends, Technical Contributions, Code Velocity, and Code Base.

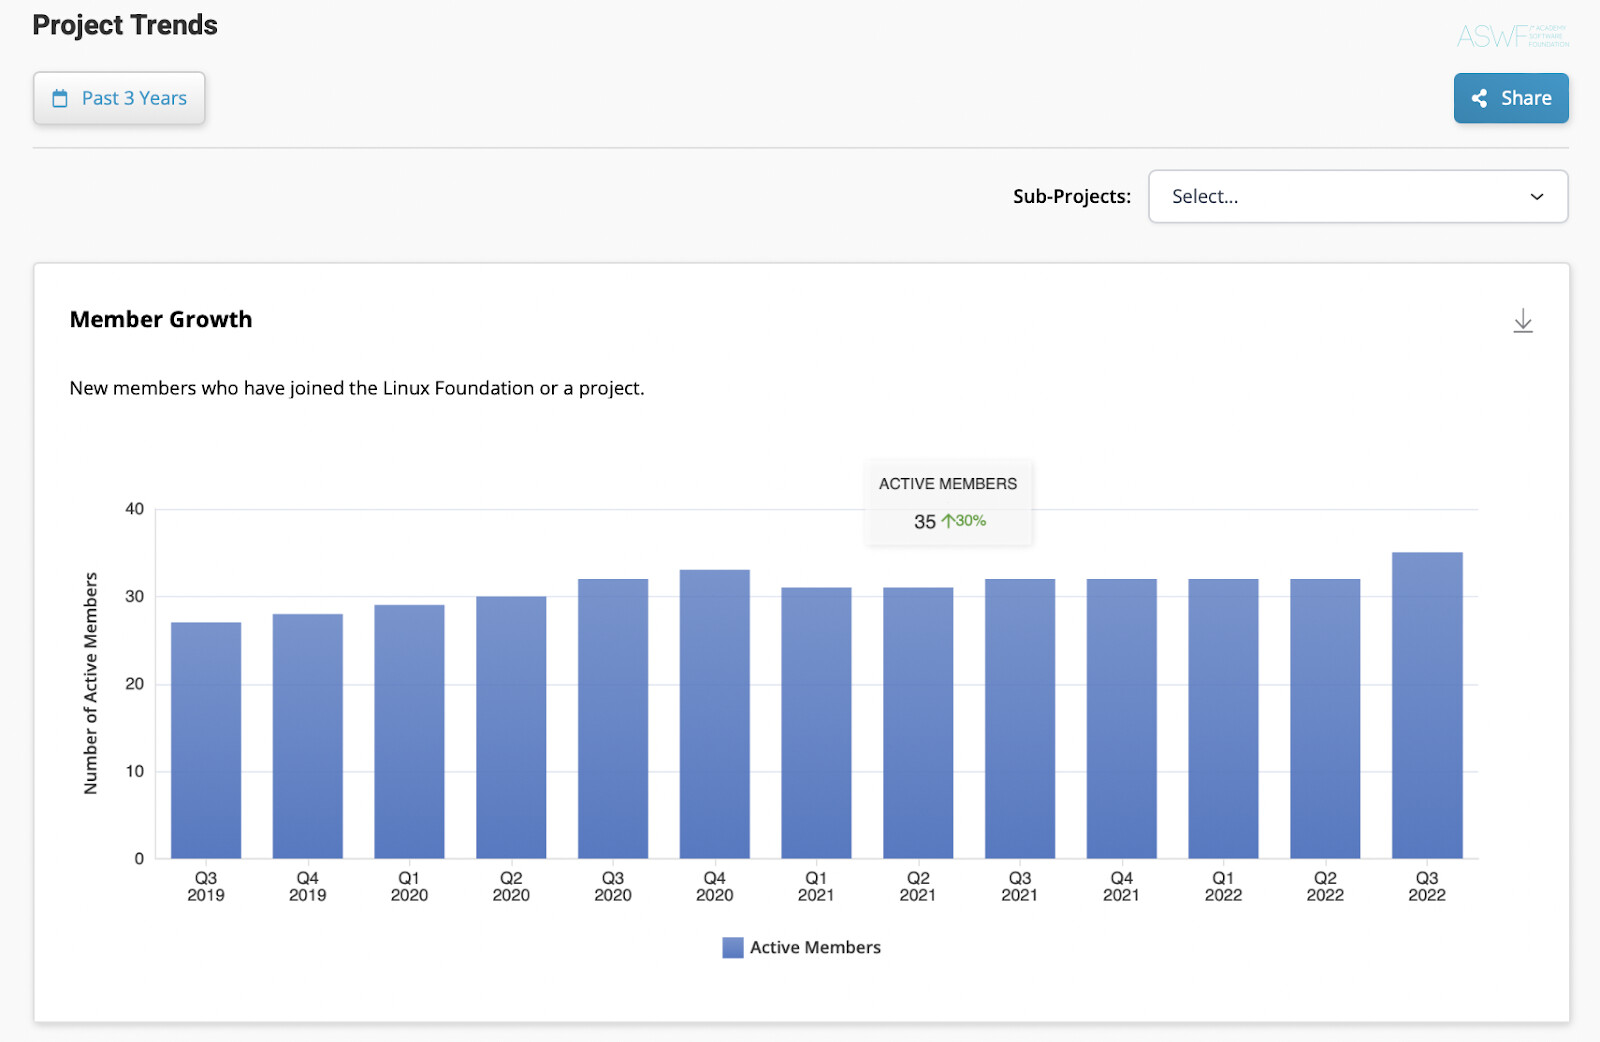
The Trends Dashboards gives you a view of new members who have joined a project. You can view Member Growth over time by changing the date range button. Attracting new members is key to achieving diversity during the project’s lifecycle.
Under Technical Contributions you will a notice a new way to display Contributor Churn

Under the Organizations tab are the Top Organizations Leaderboard by Activity Date and the type of contribution. Another way to measure your project’s diversity and engagement and also identify potential new members.
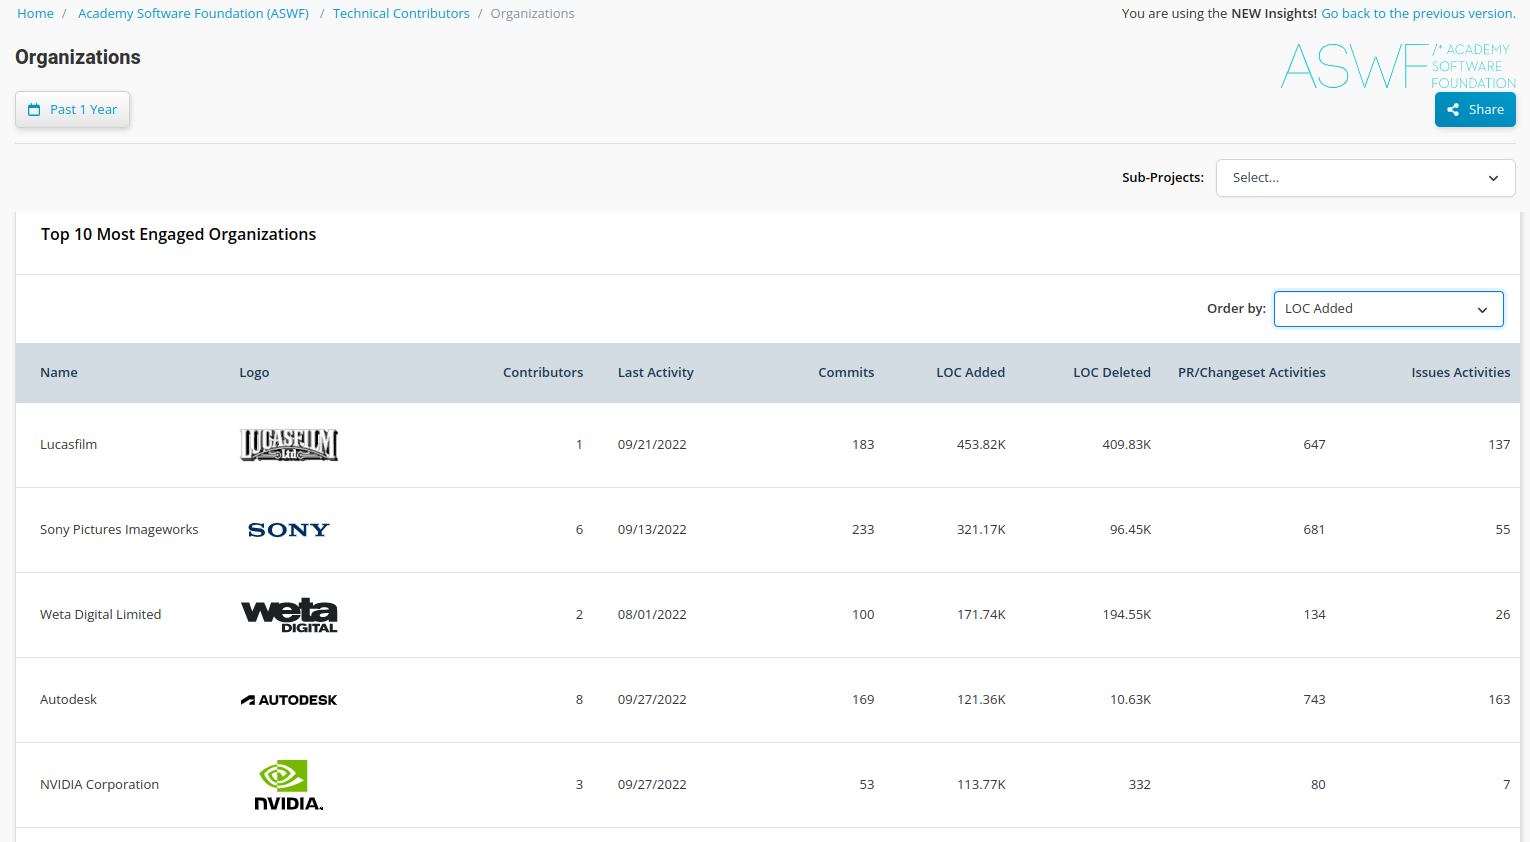
Contributor Growth & Retention and Contributors Active and Drifting Away. This allows you to see the contributions and filter by commits, LOC added and deleted, PR, and Issues activities. This information is critical in determining if you need to recruit new developers.


The charts in this section track the information that resides in your repositories and is an overview of the overall project activity.
The last dashboard in the Technical Metrics are Unaffiliated Contributors. This will show you the % of contributors that are not affiliated with an organization and/or are missing their LFIDs.

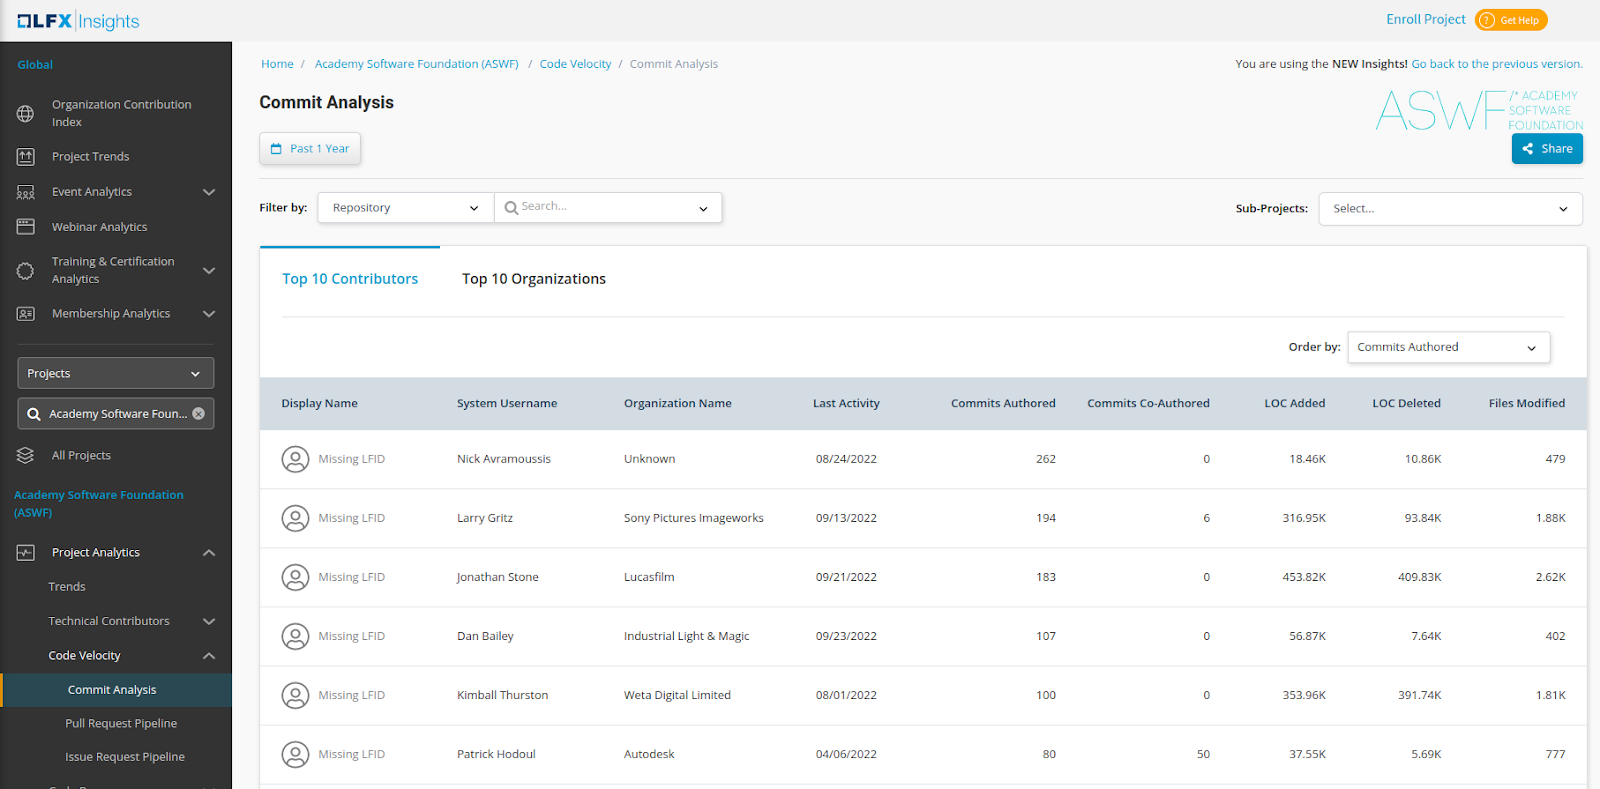
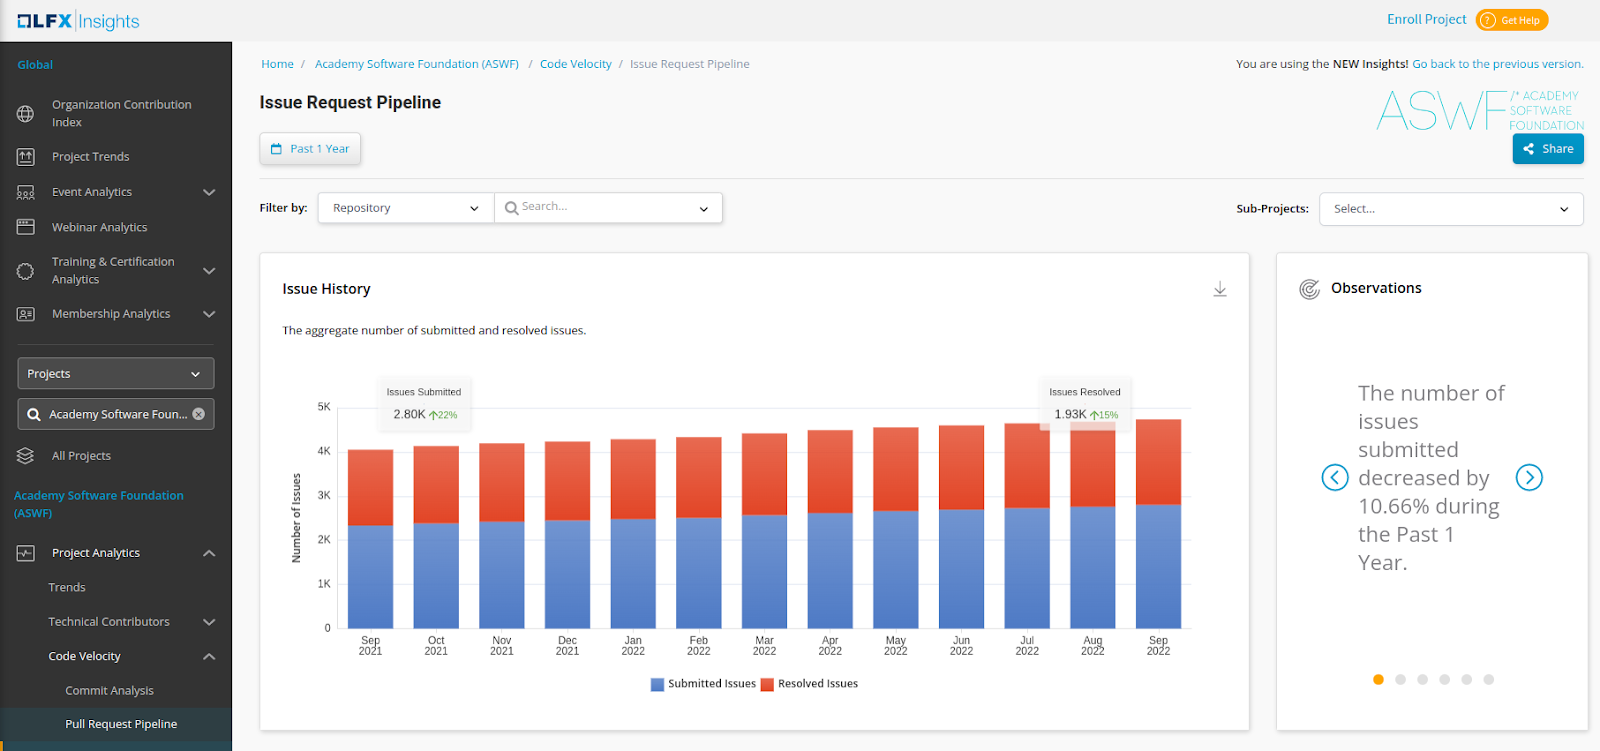
Code Velocity- Commit Analysis/Pull Requests/Issue Request Pipeline
Issue Request Pipeline will show you the number of submitted vs. resolved issues. Tracking this information will allow you to maintain momentum of the project.
Code Base- Active Repositories and Repositories that need Attention
Active code contribution activity that include commits, PRs and issues. Monitoring a project’s repositories are a critical factor in whether a project is meeting their goals.

Forks and Stars
Shows the popularity of your repositories as well as how many times has been forked to identify traction across the contributors.

Inactive Repositories
Show which repositories need to be revisited to identify if they need attention or if they need to be archived.
Open PRs and Open Issues
Shows the number of Pull Requests that have not been merged and are still in open state to bring into the attention of the reviewers to drive it further. It also displays the Issues that have not gotten any recent activity or have not been assigned.

Repositories that Need Attention
Will show you where you may need to put additional support and resources towards issue resolution management.

As you can see, the team has added additional views and graphics that monitor a project’s health. As you become more familiar with the latest version, please share with us your favorite metrics. Hit ‘REPLY’ and let us know!
To learn more about the Organization Contribution Index and Training & Certification dashboards check them out here:
Insights FAQ
You can find the latest FAQ here

